 |
| GOLD Daily |
I am watching this triangle setup from past few session and it also defines the big picture of the GOLD movement. Previous post [here].
Currently price is at lower trendline of the triangle and is bouncing as of now.
 |
| EURUSD Daily |
EUR is seen bullish across the board. EURUSD has gone more than 150pips in last 2 trading sessions.
I am looking to short this pair. A daily ascending channel might give us that opportunity. This channel is in place since last week of Aug-12.
 |
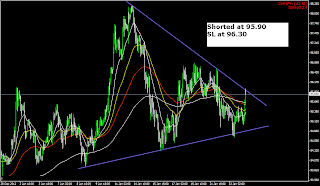
| CHFJPY Hourly |
I am watching this setup from past few sessions. Previous setup [here].
Now the trade has materialized. Price is reverting back after touching the upper trendline.
I went short right at 95.90 with stop at 96.30.
I would be targeting middle and lower part of the triangle.
---------------------------------------------------------------------
UPDATE: Got stopped out of this trade owing to further yen weakness.
 |
| AUDNZD H4 |
On H4 charts, a triangle trade trade is on cards.
This triangle is in place since mid of Dec-12. 200EMA comes near to upper trendline and currently price is going down form it.
 |
| CHFJPY Hourly |
A triangle trade is coming up in CHFJPY pair on hourly charts.
Upper trendline is connecting highs of 14-Jan and 21-Jan. While the lower trendline is connecting lows of 9Jan & 16Jan. Price is currently sitting at 200EMA and looks like price is consolidating after recent Yen weakness.
 |
| GBPUSD Daily |
Recent GBP down move has broken 3 support areas and trendline.
The trendline was holding since June-12 and has provided support on many dips. The trendline was more like providing legs to up move in GBPUSD.
 |
| EURUSD Daily |
See the channel EURUSD is making out on daily charts.
Price has just retraced back after touching upper trendline. That area also coincides with the previous highs of April-2012.
 |
| GOLD Daily |
Gold is carving out a triangle on daily charts.
Upper trendline is in place since first week of September-2011 while lower trendline is in place since mid of May-2012. Since then price is consolidating in this triangle.
A break of this triangle, brings focus to resistance & support area. A break above exposes resistance area around 1800. This area has restrained price moves since November-2011 and has been tested 3 times. A break lower of the triangle exposes support area 1525/30. This area has supported price since September-2011 and has been tested around 3-4 times.
 Daily resistance around 0.8470 is holding up again. Price is backing off after touching that area.
Any further spikes towards that area should be considered as short trade opportunity.
 |
| AUDUSD H4 |
Price is making out a triangle on H4 charts.
Upper trendline starts at the highs of 12-Dec while lower trendline starts at 23-Oct.
This can be a possible trade for next week. I expect this triangle to break on lower side.
 |
| EURUSD M30 |
Apart from the daily channel trade of yesterday, a short term channel is forming on M30 chart.
A break of that channel to the upside brings focus to horizontal resistance area.
 |
| EURUSD H4 |
I am following up this setup from past few sessions and yesterday closed my short trade for +80 pips. Previous post [here].
Now another channel setup is coming up. This time price has broken the previous hourly channel to the downside and is fast approaching the daily channel's upper trendline.
The Japanese Yen has been the worst performing major currency in the past 4 months. Looks like that its downtrend is clear.
Speculators has been quick to jump on sudden Yen downtrend. CFTC COT report hows that large speculators are now their most net short JPY ( means long USDJPY ) since 2007 when the USDJPY traded near 115.
Options data shows that traders are at their most relatively bullish USDJPY since 2004, their now exists a premium for aggressive bets on/hedges against USDJPY strength for only the second time on record.
 |
| EURUSD Hourly |
On Hourly charts, pair is trending in a slightly descending channel.
Currently price is retracing back after touching the upper trendline of the channel.
This channel provides a good scalping trade opportunity.
 |
| USDCAD Daily |
On daily charts, price is bouncing from a trendline.
This trendline is in place since mid of Sep. This trendline has been tested before and price bounced from it every time.
 |
| GBPUSD Daily |
I am watching this setup on daily charts from past few sessions and have traded it successfully. Previous trade post [here].
Price has broken above the upper trendline in thin markets of Christmas and New-Year holiday week.
I didn't took that trade because of thin markets. Moves can be irrational and volatility can he high in thin markets.


